Society and regional strategies Reading time 5 min
Landscape analysis of a land reallotment programme: the example of the implementation of LGV Grand Ouest
Published on 18 June 2018

Egis Environnement, a subsidiary of the Egis Group, was commissioned by Eiffage to set up an environmental observatory to analyse the impacts resulting from the construction of the high-speed rail infrastructure (LGV) through the Brittany - Pays-de-la-Loire regions.
Partnership between EGIS Environnement and INRA
EGIS Environnement signed a contract with INRA and entrusted the Joint Research Unit for Biodiversity, Agroecology and Landscape Development (BAGAP) with carrying out the post-construction study of changes to the bocage in zones affected by land reallotment programmes linked to the LGV. These zones lie within three French Departments: Sarthe, Mayenne and Ille-et-Vilaine and cover a total area of 11,270 ha. Construction work involved land development operations, the removal and planting of hedgerows and reforestation, all linked to the compensation measures attached to land reallotment along the infrastructure. The analysis concerned the potential impact on the hedgerow networks that serve as a habitat for numerous animal species and favour movements to meet their vital needs (food, rest, reproduction and refuge).
Maps used and parameters measured
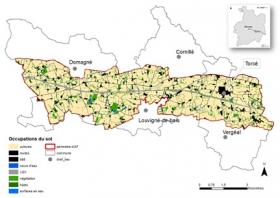
To evaluate the impact of the LGV infrastructure on the bocage, scientists from Rennes compiled two maps using different data sources (IGN, Departmental data, Eiffage, etc.):
1. A map of land occupation representing the status of the bocage network prior to construction of the LGV.
2. A map of land occupation representing the status of the bocage network at the end of land development and line construction, after the removal and replanting of hedgerows (making a distinction between planting carried out on farms and along the LGV).
Two complementary landscape metrics were measured using these maps, using the CHLOE 4.0 software developed by BAGAP:
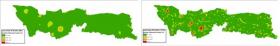
1. The density of wooded elements, which supplied information on the quantity of hedgerows and woodlots per unit of surface area. Hedgerow quantity is an important variable in terms of habitat for fauna and flora, but it is a very poor measure of the spatial organisation of these hedgerows because continuity of the bocage network is important for the movement of numerous animal and plant species which cannot cross a road or farmed plot.
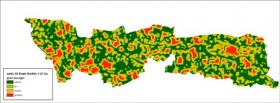
2. The grain of the hedgerow network measures the influence of hedgerows on their environment by taking account of not only hedgerow density but also plot geometry. A fine grain value indicates a strong influence of wooded elements on a plot, while a coarse grain value indicates an open environment. This landscape metric considers the spatial distribution of bocage facilitating the movement of animal species.
These two parameters are often in positive interaction, the ecological quality of a hedgerow as a habitat depending on both the hedgerow itself and its environment. These landscape metrics were measured using the sliding window method under the CHLOE 4.0 software. Two window sizes were considered: one which corresponded to an area of 1.2 ha and the other to an area of 26 ha, thus enabling modelling of the potential vital domains of species moving little or a lot.
Local modifications to the bocage network
In the three Departments studied, the bocage network was not present everywhere and some areas were devoid of hedgerows, even before construction of the LGV. However, this bocage network was not aggregated and a microclimate effect of wooded elements on surrounding agricultural plots was demonstrated.
Construction of the LGV did not modify the global density of the zone studied, although a spatial reconfiguration of the network of wooded elements was observed.
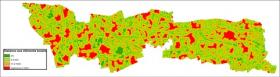
The input of hedgerow planting, mainly along the LGV, has permitted the maintenance of species dependent on the bocage environment and their movements through the area. However, the analysis revealed zones where the network had been weakened because of plot modifications, and the removal of hedgerows which had not necessarily been compensated for by planting around the same plots. In these zones, the bocage was reduced and fragmented and therefore offered fewer opportunities for the habitat and movement of animals. Spatial configuration of the bocage network is an essential factor in the maintenance of these species, hence the importance of it being connected in order to facilitate their movements and supply a favourable wooded habitat.
However, it is necessary not to overlook the "barrier" constituted by the infrastructure which prevents the movement of species due to fencing and risks of collision. The introduction of underground or raised passages can overcome these problems.
Conclusions should not be drawn too hastily
The analysis offered a prediction of the future state of the bocage as cartographical analysis considers that newly planted hedgerows have the same ecological function as the network of hedgerows present for many years. Young vegetation will not fulfil its role for several decades and only on condition that it is retained and correctly maintained.
Towards systematic environmental studies
This work demonstrated the importance of conducting environmental and landscape studies before land development operations in order to better predict their potential impacts and to put in place efficient compensatory measures.
They also enabled the team to propose a proven methodology to analyse landscape changes (in the context of land development) so that these effects can be monitored five or ten years later.
In the specific context of this study, an updating of the cartographical analyses in five or ten years’ time will enable a comparison between the effects anticipated following modifications to the landscape and the actual situation.
Examples of maps and graphs
pp